In March, U.S. equity markets extended the turbulence and cautious shift in investor sentiment that began in February, driven by ongoing trade tensions from steep U.S. tariffs on Mexico, Canada, and other global trade partners that intensified trade war fears and disrupted market stability. This uncertainty continued to pressure markets, particularly within mega-caps and technology, as they faced sustained declines. The U.S. Federal Reserve’s March meeting added to the unease, projecting slower growth and higher core inflation for 2025, further dampening optimism. The broader market struggled to stabilize amid these challenges, reflecting a persistent retreat from risk as President Trump’s tariff policy continues to unfold.
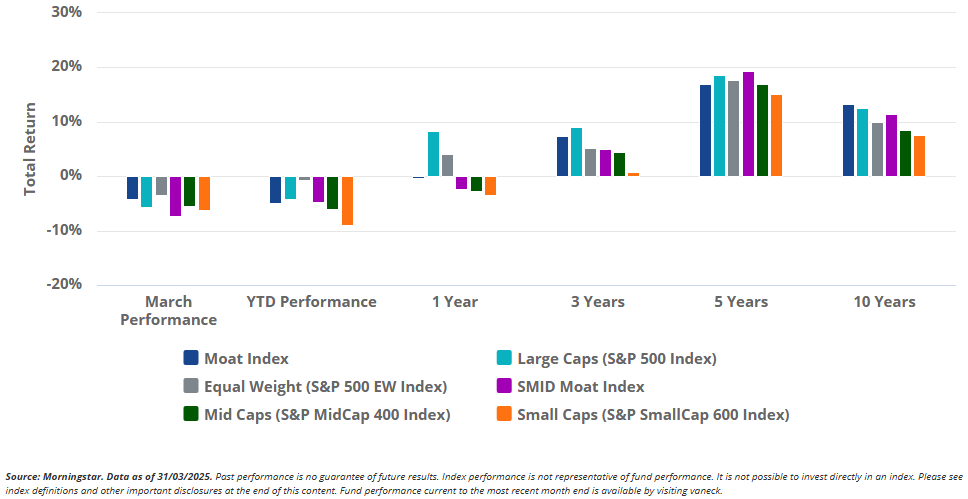
The Morningstar Wide Moat Focus Index (the “Moat Index”) was not immune to the market turmoil, as it declined along with the broad U.S. equity market ending the month lower. However, the Moat Index showed resilience relative to both the S&P 500 and the tech-heavy Nasdaq Composite. The strategy’s performance was influenced by exposure to high-quality companies in traditionally defensive sectors, such as health care and consumer staples, as well as an underweight to certain larger-cap names that experienced valuation pressures. On a year-to-date basis, as well as one year period, the moat index is still below its benchmark, because of the earning’s season volatility we described in previous blogs.
Smaller U.S. stocks were also impacted by global trade tensions and economic growth concerns with the broad small- and mid-cap benchmarks falling during the month. After outperforming during the first two months of the year, the Morningstar US Small-Mid Cap Moat Focus Index (the “SMID Moat Index”) gave up some of its lead in March, declining more than both benchmarks. However, year-to-date, the SMID Moat Index remains ahead of the broader small- and mid-cap markets.
U.S. Stocks Tariff Tumble Continued in March
Moat Strategies Target Tech at Quarterly Review
Both the Moat and SMID Moat Indexes underwent quarterly reviews on March 21, 2025. Each quarter they systematically target the most attractively priced, high quality U.S. companies within their respective universes, according to Morningstar Research. Notably, at the March review, the Moat strategies took advantage of recent market volatility by targeting valuation opportunities within the beaten down technology sector - however, investors should note that investing in undervalued or out-of-favor sectors involves the risk that prices may not recover as expected, which could negatively impact performance. See our recent blog covering the March review for more on this trend and other key insights. Full results of the quarterly reviews are also available here: Moat Index and SMID Moat Index.
Additionally, in our moat investing webinar, we go even more in-depth on the quarterly review, current positioning, as well as recent performance. We also host members of Morningstar’s equity research team to share their perspectives on market trends and the companies they cover. View the webinar here: Market Wake-Up Call: Diversify Your Core Equity Exposure
Moat Index March Highlights: Battleships Weathered Rough Seas
Sector allocations within the Moat Index were the primary drivers of outperformance versus the S&P 500 in March. A defensive posture with overweights in health care and consumer staples, as well as strong stock selection within these sectors, helped mitigate market turmoil. Avoidance of expensive mega-cap tech, one of the worst performing cohorts this month, also proved beneficial, despite hurting several previous months.
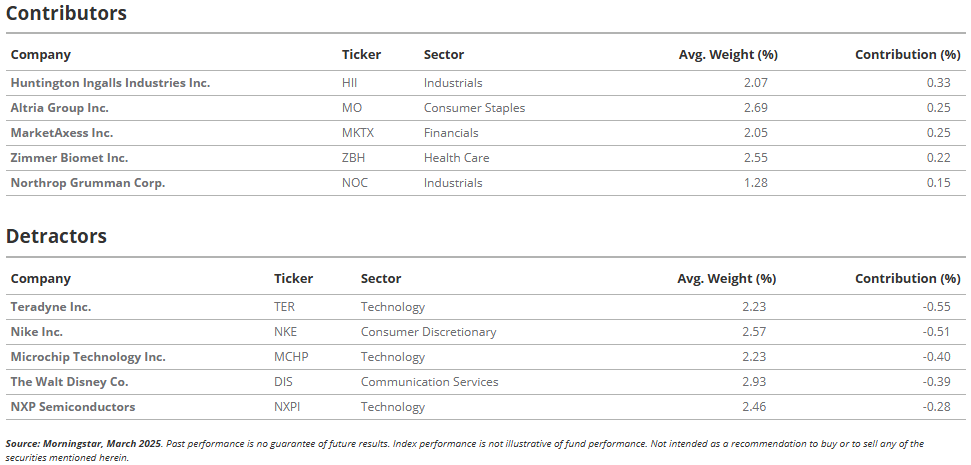
In the top slot of the contributors table this month is the wide moat industrial defense company, Huntington Ingalls (HII). Huntington is the largest independent military shipbuilder domestically and is responsible for supplying the U.S. Navy with destroyers and nuclear submarines. HII also operates a business segment focused on development of autonomous uncrewed sea vessels and other technology services that U.S. government agencies depend on. Given that Huntington is one of only two major shipbuilders for the U.S. Navy, Morningstar believes HII benefits from the U.S.’s vested interest in maintaining the financial viability of the company. Shares of HII bounced in March, rebuking market turbulence to gain more than 15% during the month. Despite the rise, shares remain well below Morningstar’s current $312 estimate of fair value.
Other top contributors within the Moat Index during the month include the consumer staple and leading cigarette brand parent firm Altria (MO), electronic bond trading platform operator MarketAxess (MKTX), orthopedic implant and medical device company Zimmer Biomet (ZBH), and the industrial aerospace and defense company Northrop Grumman (NOC).
On the opposite end, companies detracting the most in March include a few semiconductor and technology names with Teradyne Inc. (TER), Microchip Technology (MCHP) and NXP Semiconductors (NXPI) all landing in the leading detractors table. Global footwear and apparel brand Nike (NKE) and entertainment, sports, and experiences stalwart Walt Disney Co. (DIS) also detracted during the month.
Moat Index Top Contributors and Detractors - March 2025
SMID Moat Index March Highlights: Electric Bonds Buck Turmoil
The SMID Moat Index’s March underperformance, relative to small- and mid-cap broad benchmarks, was driven by a combination of stock selection and exposure to more cyclical segments of the market as consumer discretionary names were well-represented within the top detractors table this month.
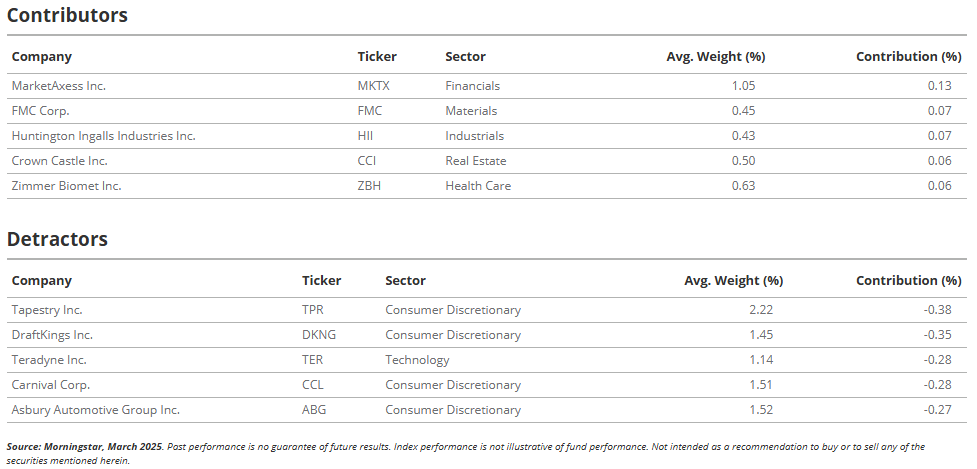
Despite the sharp selloff this month, several companies within the SMID Moat Index managed to buck the trend and post positive returns. MarketAxess Inc. (MKTX), a leading electronic fixed-income trading platform, lands as the top example. MarketAxess has built a dominant position in the section of the bond market that is electronically traded, and the firm has benefited significantly from the ongoing transition in fixed-income markets toward electronic trading and away from voice negotiated trades. This secular trend has provided MarketAxess with steady growth as the implicit and explicit trade cost reductions offered through its electronic trading protocols pulls more clients and trading volume to its platform. Shares of MKTX gained more than 12% in March, but Morningstar continues to view shares as attractive compared to their $260 fair value assessment. Investors should keep in mind that past performance is not an indicator of future results.
Other top contributors that broke rank in the down market include pure-play global agriculture and crop protection company FMC Corp. (FMC), the above-mentioned military shipbuilder Huntington Ingalls Industries Inc. (HII), wireless cell tower and fiber communication infrastructure operator Crown Castle Inc. (CCI), and orthopedic implant and medical device company Zimmer Biomet (ZBH).
Names that detracted most from the SMID Moat Index performance during the month include luxury fashion and accessory brands company Tapestry (TPR), online sports and casino gambling innovator DraftKings Inc. (DKNG), semiconductor testing equipment manufacturer Teradyne Inc. (TER), cruise line operator and travel service provider Carnival Corp. (CCL), and regional automobile dealership group owner Asbury Automotive Group Inc. (ABG).
SMID Moat Index Top Contributors and Detractors - March 2025